Topics:
Never Miss a Beat - Get Updates Direct to Your Inbox
FILTER:

How Multiple Averages are Used in Website Valuation
By Quiet Light
Centurica’s Website Buyer’s Report does a fine job of examining the overall activity in the website marketplace. It covers multiple aspects of the buying and selling process, and offers actionable tips from industry experts. But before putting its advice into action, however, buyers should proceed with caution, especially regarding multiple averages.
“Never Overpay Again”
The Centurica report promises to help buyers “Never Overpay Again”. This seems to be its general purpose: to act as a guide for how much a buyer should pay for an online business based on the average multiples within the industry and select segments.
The report’s creator, Justin Gilchrist, gathered data from more than 500 transactions for this report. Can we use this as a guide for what a buyer should pay for a business?
Not only is the sample size most likely not comprehensive when proper segmentation is considered, the report fails to include information and metrics that would be quite helpful for buyers.
But that’s not the real danger. The heavy focus on multiple averages causes really strong businesses to not enter the market. This ultimately hurts buyers who are looking for great opportunities.
The Problem with Average Multiples is Segmentation
 Averages should not be used as the only benchmark for how to value a specific business unless the average you are referencing is in a very well defined segment.
This is one area where Centurica’s report falls short. The problem with averages is that you must define your segments very precisely in order to get real, actionable data.
Consider two hypothetical listings:
| E-Commerce Business A | E-Commerce Business B |
|---|---|
| All inventory is self-fulfilled | All inventory is self-fulfilled |
| Unique product line, with relatively stable competition | Unique product line, with relatively stable competition |
| Seven-year operating history | Seven-year operating history |
| 35% gross profit margins | 35% gross profit margins |
| Business has had steady earnings for the past three years | Business has had steady earnings for the past three years |
| 35 hours a week to run | 35 hours a week to run |
| Annual earnings: $10,000 | Annual earnings: $750,000 |
(hint: they are exactly the same, except earnings)
How much should you pay for each of these businesses? According to Centurica’s report, both businesses would fetch three times their annual earnings. E-Commerce Business A should receive $30,000, and E-Commerce Business B would get the same multiple, with its asking price set at $2,250,000.
But do these prices reflect the actual market for each of these sites? Most likely not.
While they may appear to be identical except for their annual earnings, the earnings each produces significantly changes the nature of the business’s value.
In the marketplace, Business B will nearly always command a higher multiple. Business B simply has more demonstrated value.
[columns] [one_half]
Business A
[list type=’check-color’]
- Requires a lot of work (35 hours a week) for low earnings.
- Has little room for error.
- Hard to invest in external help without destroying profits.
[/one_half] [one_half]
Business B
- Same amount of work, but far greater earnings.
- Can withstand a negative event and continue to profit.
- Can invest in outside help and reduce workload.
[/one_half] [/columns]
Business B is more valuable because it is stronger, better suited to withstand risk, and provides a greater benefit for its time requirement.
How Advanced Metrics Would Help

While lack of proper segmentation is one significant issue in this report, including proper segmentation was likely not a realistic goal. It’s nearly impossible to account for every scenario through segmentation alone.
Centurica could help buyers with the inclusion of two basic pieces of data:
- Multiple ranges
- Scatter plots
Why multiple ranges? As noted above, averages don’t always capture the proper segmentation, and significant skewing can occur.
- The business that is growing at 50% year over year is lumped together with the business that is falling 50% year over year.
- The seller who is not motivated to sell is lumped together with the seller who needs to sell as quickly as possible.
Stating a range of multiples would be useful in capturing, at least in part, the finer shades of these different scenarios within a segment.
Even more helpful would have been the inclusion of scatter plots for each category. Data sets do not always congregate nicely around the average, and sometimes an average is actually the result of two or more groupings within a dataset. Take the following example:
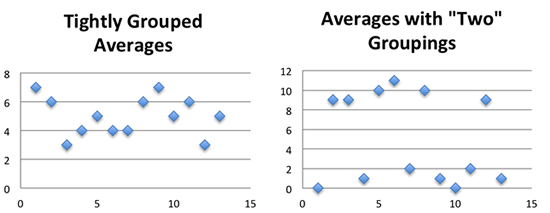
Both sets of data have an average of “5”, but in the first graph the data groups tightly around the average whereas the second set groups around two extreme points.
We can see this behavior in certain business niches. eCommerce businesses tend to group more tightly around their average whereas lead generation tends to garner either high multiples or very low multiples, but not as many in the middle. If you are evaluating a lead generation company and rely solely on the average, relying on averages may lead you to think that a good company is terribly over-priced.
In addition to offering a simple range of multiples and scatter plots, why not include a few advanced metrics for buyers? Analysis such as standard deviation, variance, kurtosis, or a coefficient of determination would all be helpful statistics. Obviously most buyers are not familiar with such metrics, but lack of familiarity isn’t a reason to not include useful information, especially when these metrics can be explained in the report.
The Consequences: Good Businesses Aren’t Entering The Market
Despite these criticisms, I would still strongly recommend downloading the report (really, go download it). Smart buyers will know that these averages are not firm guides, but a piece to a larger puzzle. Smart buyers will also enjoy some of the niche analysis provided.
However, as an industry, we need to be careful to not become too beholden to what the “average” asking price is. What we pay for a business should depend on the relative strength of that business, and the competitive pressure of the market.
The reality is that a lot of high quality businesses are not for sale simply because the owners see that the market isn’t willing to extend past the “average”, and the current average just doesn’t make sense for them to sell. Their businesses are too strong, too lucrative, to sell at existing market averages. If the market was willing to entertain higher multiples, buyers would find a number of very strong, low-risk businesses that offer a strong potential ROI.
What do you think? How much do industry averages influence what you are willing to pay for a business? How much more would you pay for a business that is extremely strong?
Comments are closed.


Mark,
Very interesting post. I started composing a reply, but got to 600+ words and decided it was probably more than a comment!!
I have some justification and reasons why I don’t fully agree here – http://www.flipfilter.com/blog/the-dangers-of-multiple-brokers/
All the best